

Labor is one of the largest cost categories in most technology organizations, yet it remains one of the most complex to model within a Technology Business Management (TBM) model. Labor costs are typically aggregated at cost center or payroll level in source systems and do not inherently reflect how effort is consumed across technology capabilities. Translating this aggregated spend into meaningful, TBM-aligned structures requires defined allocation approaches and supporting data.
This guide is intended primarily for TBM Administrators responsible for building, maintaining, or improving labor cost allocation within the TBM Model. It is also relevant to TBM Analysts, IT Financial Management (ITFM) and Finance practitioners, and transformation teams that contribute data, allocation logic, or subject-matter expertise to the modeling process. It aligns to core elements of the TBM Model and Taxonomy, including the Staffing Cost Pool, Technology Resource Towers, and the flow of cost data from source systems to business-facing consumption views.
The paper focuses on allocating labor costs to Technology Resource Towers (not sub-towers) to support consistency, comparability, and practical implementation; sub-tower allocation can provide additional granularity but typically requires more mature data, detailed mappings, and increased governance, and can be layered on as TBM maturity evolves.
This guide can be applied across different stages of TBM adoption, from establishing baseline labor allocation using available financial and organizational data, through to combining multiple approaches to support cost transparency, showback, and decision-making.
It provides a structured overview of labor cost classification, cost flow across the TBM model, commonly used allocation approaches and their data requirements, and practical considerations for implementing and governing labor cost allocation. The focus is on applying allocation approaches within a TBM-aligned cost model, rather than defining elements of the taxonomy itself.
Because most TBM labor models use a combination of methods across different workforce segments, readers should use the decision framework in the Choosing the Right Methodology section, to select the most appropriate approach for each cohort.
TBM Labor Cost Pool Structure
TBM Taxonomy 5.0.1 defines labor within the Staffing Cost Pool, one of the primary technology cost pools. For trackable labor, the taxonomy uses five staffing sub-pools. Keeping these sub-pools distinct is essential for benchmarking, headcount analysis, capitalization treatment, and run-versus-change reporting.
Not all workforce-related spending should be classified within the Staffing Cost Pool. A critical distinction in TBM is whether there is line-of-sight to identifiable individuals and their work.
- The Staffing Cost Pool includes internal employees and contractors where individual roles, activities, or assignments can be identified and mapped to technology functions or towers.
- Outside Services includes vendor-delivered or managed services where outcomes are contracted, but individual resources, effort, or role-level detail are not visible to the organization.
In practice:
- A contractor working as part of an application support team with known responsibilities is treated as Staff Augmentation (labor).
- A managed service provider delivering end-to-end infrastructure or service desk outcomes without visibility of individual personnel is treated as Outside Services.
This distinction ensures that labor cost modeling reflects how work is performed, while outsourced or outcome-based services are represented separately to support sourcing decisions, benchmarking, and cost transparency across delivery models.
| Sub-Pool | Labor Type | Typical GL Accounts | Headcount Impact |
| Internal Labor | Permanent and part-time employees performing operational technology work | Salary, wages, superannuation, and core benefits | In headcount |
| Internal Labor Capital | Capitalizable employee labor for building or enhancing technology assets | Capital labor journals, project payroll, capital development labor | In headcount |
| Staff Augmentation | Contract workers with line-of-sight to individuals and work performed | Contractor invoices coded to operating labor accounts | Usually outside employee headcount |
| Staff Augmentation Capital | Capitalizable contract labor tied to long-term technology assets | Capital project contractor invoices, implementation labor capital | Not in employee headcount |
| Other Operating | Other employee-related labor costs not covered above | Severance, training-related labor, labor settlements, central labor overheads | Typically outside headcount metrics |
Using the Staffing Cost Pool without its sub-pools provides only an aggregate view of labor cost. The five Staffing sub-pools provide the additional classification needed to understand the distribution of staffing costs, including internal versus staff augmentation labor and operating versus capitalized labor. This detail supports analysis of workforce composition and sourcing decisions. Managed services and outsourced functions that do not contribute to organizational headcount should generally be classified outside the Staffing Cost Pool, such as within Outside Services.
Labor Cost Flow: GL to Business Units
The TBM Model organizes technology costs using the four layers defined by the TBM Taxonomy: Technology Cost Pools, Technology Resource Towers, Technology Solutions, and Technology Consumers. Supporting financial, organizational, operational, and consumption data provides the classifications, mappings, and allocation drivers used to populate the model and move costs between these layers.
Although the TBM Model traces technology costs across all four layers, this paper focuses specifically on labor cost allocation from the Staffing Cost Pool to Technology Resource Towers. It addresses how Staffing costs can be assigned across Towers when organizations have different levels and types of labor data available; allocation to Sub-Towers, Solutions, and Consumers is outside its scope.
The accompanying TBM Model places this allocation in context, showing where the Staffing Cost Pool and Technology Resource Towers sit within the broader model, how they correspond to the TBM Taxonomy, and where supporting data enters the model to enable allocation.
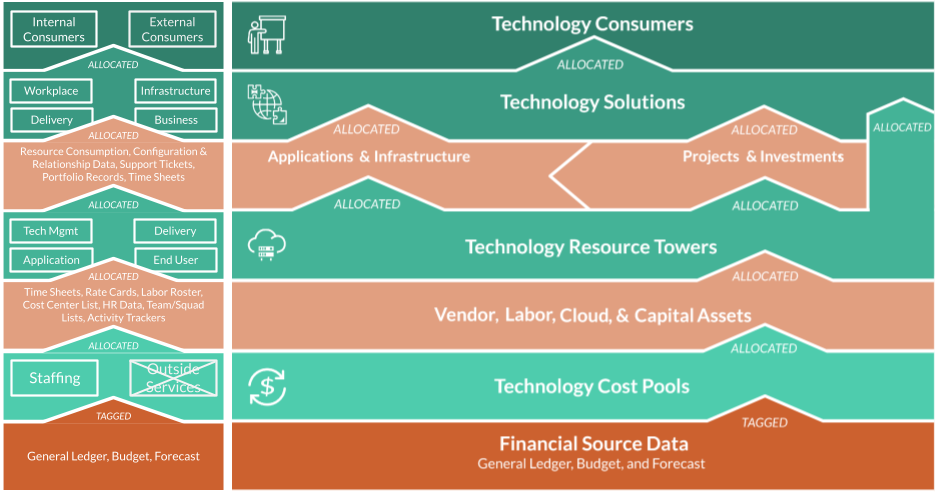
Cost Pools
The Cost Pools layer classifies technology spending according to the nature of the expense before it is allocated elsewhere in the model. This paper focuses specifically on the Staffing Cost Pool, where labor costs are assigned to the appropriate staffing sub-pools before any further allocation occurs.
Every dollar of trackable labor should be classified into one and only one Staffing Cost Pool and sub-pool before any allocation methodology is applied. Once classified, those costs can be allocated to Technology Resource Towers using one or more of the methodologies described in Section 4.
Supporting Data: General Ledger transactions provide the financial foundation for the model, while budget and forecast data enable planning and variance analysis. Payroll, procurement, accounts payable, and HR systems provide the information required to classify labor into the appropriate Staffing Cost Pool sub-pools before allocation begins.
Technology Resource Towers
Technology Resource Towers organize technology resources according to the capabilities that perform the work. Labor costs allocated from the Staffing Cost Pool become part of those resource costs.
It is at this level that the labor allocation methodologies described in Section 4 are primarily applied. Each methodology provides a different approach for assigning Staffing costs to Technology Resource Towers based on the quality, granularity, and availability of organizational and operational data.
Supporting Data: Organizational structures, cost center hierarchies, HR data, role definitions, resource assignments, project information, and time tracking systems provide the classifications, mappings, and allocation drivers used to assign labor to the appropriate Technology Resource Towers.
Technology Solutions
Technology Solutions represent the products, platforms, applications, and services delivered by technology. Once labor has been allocated to Technology Resource Towers, those costs are assigned to the Technology Solutions they support using application, service, product, platform, or other operational relationships.
Once labor has been assigned to Resource Towers, the existing relationships between technology capabilities and Technology Solutions allow those costs to continue flowing through the TBM Model without requiring different labor allocation methodologies.
Supporting Data: Application portfolios, service catalogs, product catalogs, CMDBs, project portfolios, and platform ownership information provide the classifications, mappings, and allocation drivers that connect Technology Resource Towers to Technology Solutions.
Technology Consumers
Technology Consumers represent the business organizations, products, channels, customers, or other entities that receive value from technology. Solution costs are allocated to Technology Consumers using appropriate business or consumption drivers.
The resulting Consumer views enable business-facing reporting that supports cost transparency, showback, chargeback, benchmarking, planning, and value-based decision-making.
Supporting Data: Business hierarchies, organizational ownership, user populations, transaction volumes, consumption metrics, revenue information, and agreed business allocation rules provide the classifications, mappings, and allocation drivers used to assign Solution costs to Technology Consumers.
Labor Allocation Methodologies
There is no single method for allocating labor within a TBM model. In practice, organizations apply multiple allocation approaches in parallel, using different methods for different workforce segments based on data availability, organizational structure, and required decision outcomes.
For example, dedicated teams may be allocated using direct cost center mapping, while shared teams are allocated using role-based, time-based, or proxy-driven methods. These approaches are often combined within a single model, with each method applied where it provides the most reliable representation of how labor is consumed.
For a practical selection framework that explains how to choose between these methods by workforce segment, see the Choosing the Right Methodology section below.
To ensure consistency, organizations define allocation rules and precedence, such as prioritizing timesheet data where available, applying role-based mapping where time data is not available, and using proxy drivers as a fallback. This creates a structured and repeatable allocation approach while accommodating variations in data quality and maturity.
The methodologies below describe common approaches that can be applied individually or in combination, depending on context.
Direct Cost center Mapping
Purpose
Use direct cost center mapping where a cost center is dedicated to a single Technology Resource Tower or a clearly defined technology function. This method is intended to provide a simple and transparent allocation where organizational structures already align to the TBM model.
Required Data
- Cost center list, hierarchy, and ownership
- General Ledger labor costs mapped to cost centers
- Organizational context to confirm team purpose and scope
- TBM taxonomy mapping showing which tower the cost center supports
How it works
If a cost center supports one tower only, the labor cost of that cost center is mapped directly to that tower. Where a cost center contains more than one function, this method should only be used if the cost center can first be decomposed into defensible splits or reassigned to a more suitable method.
Illustrative example: An organization has a dedicated Network Operations center (NOC) cost center containing 12 engineers whose role is exclusively to operate and monitor wide-area network infrastructure. All salary and on-costs from this cost center map directly and entirely to the Network Tower.
Role and Rate Card Mapping
Purpose
Use role and rate card mapping where a cost center contains multiple identifiable roles and direct mapping is not sufficiently precise. This method is intended to improve allocation accuracy by decomposing labor cost into role-based components before mapping those roles to towers.
Required Data
- Employee listing or roster
- Job titles, job families, grades, or role categories
- Rate card or standard fully loaded labor rates by role
- General Ledger labor costs by person or cost center
- TBM taxonomy mapping from roles to towers
How it works
The labor cost of a cost center is decomposed into positions using a role-based rate card. Each role is assigned a standard cost and then mapped to one or more towers. Where a role spans multiple towers, percentage splits are applied using an agreed mapping table. Actual General Ledger totals remain the financial base; the rate card is used to calculate how cost is distributed, not to replace actuals.
Illustrative example: A shared IT Operations cost center has a total spend of $1.2M and contains five positions: two Senior Infrastructure Engineers (rate card: $180K each), one Database Administrator ($160K), one Service Desk Manager ($130K), and one CISO ($220K). The rate card weights sum to $870K, and each position’s share of the $1.2M is calculated in proportion to its rate. The Infrastructure Engineers map to the Compute Tower, the DBA to Data and Analytics, the Service Desk Manager to End User, and the CISO to Security. Each position’s dollar share flows directly to its assigned tower in the infrastructure layer.
Time Tracking / Timesheet-Based Allocation
Purpose
Use time tracking allocation where recorded time pfrovides the most direct evidence of how labor effort is consumed across towers, solutions, projects, or run/change activities. This method is intended to provide more granular and operationally grounded allocations than organizational or role-based estimates.
Required Data
- Employee or contractor timesheet records
- Time entry codes and descriptions
- Mapping from time codes or project codes to towers and/or solutions
- Labor cost by person or cost center (GL Data)
- Governance rules for validation, completeness, and fallback handling
How it works
Recorded hours are converted into percentage allocators by person, team, or cost center. Those percentages are then applied to actual labor cost. Because timesheet systems do not usually record TBM tower names directly, time codes, project codes, or work categories must first be mapped to towers and, where relevant, to solutions or run/change classifications. Where timesheet coverage is incomplete, a fallback method should be defined for missing or non-compliant entries.
Generic example: A team of 20 engineers uses a project and resource management system. Each week, engineers code hours against projects and operational activities. At month end, the TBM model extracts the hour distributions and applies them to split each engineer’s salary across the Application, Delivery, and Compute towers in proportion to actual time spent.
Proportional and Proxy Driver Allocation
Purpose
Use proxy allocation where direct labor evidence is unavailable and a logical operational driver is needed to estimate how effort is distributed. This method is intended for shared or corporate functions whose work spans multiple towers and cannot be observed directly at person or role level.
Required Data
- Labor cost by team, function, or cost center (GL data)
- A selected proxy driver, such as ticket volumes, asset counts, project counts, prior-period survey results, service ownership counts, or fixed allocation % agreed with service owner
- Documented rationale for why the proxy reflects effort
- Review cadence and ownership for maintaining the proxy
How it works
A proxy is selected based on its logical relationship to labor effort. The proxy is converted into allocation percentages and then applied to labor cost for the relevant team or function. This method depends on clear governance: the proxy must be documented, periodically reviewed, and replaced if it no longer reflects how work is actually distributed.
Generic example: An Enterprise Architecture team of eight architects supports the organization’s technology change portfolio, but no time records exist. The active initiative register shows that 40% of current initiatives primarily involve the Application Tower, 25% Delivery, 20% Security, and 15% Technology Management. The team uses these proportions as proxy allocation drivers for its labor cost, with the distribution reviewed each quarter as initiatives begin and close.
Activity-Based Costing (ABC)
Purpose
Use Activity-Based Costing where teams perform repeatable activities across several towers or solutions and role-level mapping is too broad to explain how labor effort is consumed. This method is useful when the activity performed is a better allocation signal than the role title or cost center.
Required Data
- Activity catalog with clear activity definitions
- Effort survey, time study, or sample-based activity capture
- Activity-to-tower or activity-to-solution mapping
- Actual labor cost by team, person, or cost center
- Review owner and cadence for refreshing activity splits
How it works: Activity-Based Costing first decomposes labor into the activities employees perform, rather than assigning labor directly based on organizational structure or job role. Activity percentages are established through time studies, surveys, work sampling, or other representative measurements. Each activity is then mapped to one or more Technology Resource Towers or Technology Solutions using appropriate allocation drivers. Finally, labor costs are allocated in proportion to the effort assigned to each activity, producing a more accurate representation of how work is actually performed.
Generic example: An IT Service Management team of 15 staff performs five primary activities: incident management, change management, problem management, service catalog management, and continual service improvement. A representative time study shows the team’s effort is distributed 40%, 20%, 15%, 15%, and 10% across these activities. Each activity is then allocated to one or more Technology Resource Towers based on the technology functions it supports, allowing the team’s labor costs to flow through the TBM Model according to the work performed rather than the staff members’ job titles.
Agile / Squad-Based Allocation
Purpose
Use Agile or Squad-Based Allocation where stable teams are aligned to products, platforms, services, or solutions and planning records provide a reliable view of team capacity. This method is useful when team topology, rather than cost center or job title, best reflects how labor is consumed. It should not assume that every squad maps neatly to one tower. Where a squad performs work across multiple technology capabilities, the TBM Administrator should use the service catalog, product catalog, activity taxonomy, and planning records to determine whether the squad cost should be split across towers, allocated to a solution, or, in limited cases, passed through directly to the consumer layer where tower attribution would be artificial.
Required Data
- Team or squad List
- Squad-to-product, platform, service, or solution mapping
- Sprint, quarterly, or PI planning records
- Capacity allocation percentages where squads support more than one product or solution
- Actual labor cost by person, squad, or cost center
- Service catalog or product catalog showing which services, platforms, and solutions each squad supports
- Service-to-tower mapping, activity-to-tower mapping, or documented exception rule where the cost bypasses tower allocation and lands directly on the solution or consumer
- Team or squad List
- Squad-to-product, platform, service, or solution mapping
- Sprint, quarterly, or PI planning records
- Capacity allocation percentages where squads support more than one product or solution
- Actual labour cost by person, squad, or cost center
- Service catalog or product catalog showing which services, platforms, and solutions each squad supports
- Service-to-tower mapping, activity-to-tower mapping, or documented exception rule where the cost bypasses tower allocation and lands directly on the solution or consumer
How it works: In agile organizations, team topology is the starting point, but it is not the final allocation answer. The TBM Administrator first identifies the squad, its actual labor cost, and the product, platform, service, or solution it supports. The service catalog is then used to connect that product or service to Resource Towers where a tower relationship is clear. For example, a squad supporting a customer portal may split effort across Application, Data, Security, and Delivery based on backlog tags, service components, or agreed capacity splits. A platform engineering squad may map to Compute, Storage, Network, and Security based on the services it operates. Where the squad supports a business-facing solution and no meaningful tower-level split can be defended, the model may allocate the cost directly to the solution or consumer layer, with the bypass documented as an exception and reviewed through governance.
Generic example: A digital product squad supports an online customer portal listed in the service catalog. The portal service is made up of application features, data services, authentication controls, and release management. PI planning records show the squad’s capacity split for the quarter as 50% feature delivery, 20% data integration, 15% security and identity work, and 15% release coordination. The TBM Administrator maps these activity categories to Resource Towers as Application 50%, Data 20%, Security 15%, and Delivery 15%, then applies those percentages to the squad’s actual labor cost. If another squad supports a single business-facing solution but there is no reliable activity, component, or service catalog basis for a tower split, the cost may be allocated directly to that solution or consumer, provided the exception is documented and approved.
Methodology Comparison
The table below provides a quick-reference comparison of the six methodologies.
| Methodology | Data Required | Best Used When | Confidence Level |
| Direct Cost center Mapping | Cost center codes, org chart | Team is 100% dedicated to one tower | High when validated; otherwise medium |
| Role / Job Family Mapping | Job titles, headcount, salary bands | Mixed cost centers, no timesheets | High: 80-90% |
| Time Tracking (Timesheets) | Active timesheet / PPMS system | High-cost teams; run/change split needed | Highest: 90-98% |
| Proportional / Proxy Driver | Proxy metric (tickets, assets, etc.) | Shared/corporate functions, no timesheets | Medium: 65-80% |
| Activity-Based Costing | Time surveys, activity definitions | IT management, governance overhead | High: 80-90% |
| Agile / Squad-Based | Team roster, PI planning records | Agile delivery model in place | High: 85-95% |
Practical Examples: Hybrid Allocation Methodologies
Hybrid allocation methodologies are used when no single allocation method can reasonably assign all labor costs. Rather than selecting one methodology for an entire labor population, organizations often apply multiple allocation methods in sequence. An initial method allocates the labor that can be assigned with high confidence, while additional methods are used to allocate the remaining labor costs using the best available evidence for each remaining segment. The objective is not to apply the same methodology everywhere, but to achieve complete, defensible allocation coverage while preserving financial integrity..
Example 1: Rate Card + Cost center (combined)
When to use: Use this approach when cost centers are the most reliable organizational anchor, but greater accuracy is required than a pure cost-center-to-tower mapping provides. A rate card (or role-based standard cost) improves comparability and supports scenarios where payroll data is variable or incomplete (for example, blended contractor and FTE populations). The cost center provides the allocation context, while the rate card provides a consistent unit cost by role.
| Inputs
• GL labor cost by cost center |
→ | Step A: Build allocators
1) Assign each person a standard cost from the rate card |
→ | Step B: Apply costs
Allocate actual GL cost-center totals using the allocator % (rate-card-derived). Output to tower/application/business unit. |
| Cost center | Role Mix (count) | Rate Card Cost | Allocator % | Apply to GL Actual |
| CC100, Shared Ops | 2× Service Desk, 1× Network Eng | 2×\$12k + 1×\$18k = \$42k | End User 57% Network 43% |
GL actual \$50k → End User \$28.5k, Network \$21.5k |
Controls: Reconcile allocator totals to 100% per cost center, flag roles missing from the rate card, and maintain a quarterly review cycle with tower owners. Use the rate card for splitting only; apply splits to actual GL totals to preserve financial truth.
Example 2: Timesheet + Cost center (combined)
When to use: Use this approach when timesheets exist but coverage is incomplete or inconsistent. Timesheets are used as the primary driver where available, and the cost center provides a defensible fallback (default tower or application split) for missing hours, non-compliant submissions, or populations not captured in the time-tracking tool.
| Inputs
• GL labor cost by person and/or cost center |
→ | Step A: Build allocators
1) Convert hours to % by person (or by cost center) |
→ | Step B: Apply costs
Allocate actual salary/contractor cost per person (or cost center) using the blended % (timesheet first, fallback second). |
| Person / CC | Timesheet Hours | Fallback (CC default) | Final Allocator % | Apply to Actual Cost |
| Alex (CC200) | 120h App A, 40h App B (160h total) | Not used (meets threshold) | App A 75% App B 25% |
\$15k → App A \$11.25k, App B \$3.75k |
| Sam (CC200) | 60h App A (missing 100h) | CC200 default: App A 60%, App B 40% | App A 60% App B 40% |
\$15k → App A \$9k, App B \$6k |
Implementation Approach and Governance Controls
Implementation is where allocation rules move from concept to repeatable monthly processing. Regardless of the methodology selected, direct, role/rate-card, timesheet, proxy, ABC, or squad-based, a robust implementation follows the same pattern: define the allocation object, such as tower, solution, or business unit; select the driver data; apply governance controls; and automate the calculation so results are stable period-on-period.
Before implementing mapping tables and precedence rules use the Choosing the Right Methodology section to confirm which allocation method applies to each workforce segment and what fallback method should be used where data is incomplete.
Define scope and allocations depth. Confirm the monthly reporting period, workforce population, and cost types in scope, including FTE, contractors, capitalised labour, and staff augmentation. Define whether the allocation will stop at Resource Tower, continue to Solution, or extend to Consumer. This decision determines the level of mapping and validation required and if the implementation is phased.
Standardize master data before calculating allocations. Create consistent identifiers for person, worker type, cost center, role or job family, project, service, solution, tower, and consumer. Resolve duplicate names, inactive records, missing cost centers, and unmapped roles before the allocation run. Lock reference tables for each reporting period so prior-month results remain explainable.
Set driver precedence rules. Define which data source takes priority when more than one signal exists. For example, validated timesheet data may override cost-center defaults, role mapping may override a broad proxy, and a governed fallback may apply when time entries are incomplete. Document the rule sequence so the same labour population is not allocated twice.
Build and govern mapping tables. Maintain separate mapping tables for cost center-to-tower, role-to-tower, service-to-solution, service-to-tower, project-to-solution, and consumer ownership. Each table should include an owner, effective date, review date, confidence level, and exception flag. Where a mapping contains a split, the percentages must sum to 100% for the relevant person, team, cost center, or service.
Calculate allocators and check completeness. Convert the chosen driver into allocation percentages at the defined grain, such as person, cost center, squad, activity, service, or tower. Check for null mappings, duplicate allocations, outliers, and percentages that do not total 100%. Where thresholds are used, such as timesheet sufficiency, define the threshold and fallback treatment before running the model.
Apply costs to actual financials. Use the allocator percentages to distribute actual General Ledger labour cost, salary cost, contractor invoices, or capitalised labour journals. Rate cards, surveys, and proxy drivers should be used to split the cost, not replace actual financial totals. Reconcile the allocated output back to the GL control total for each period.
Validate results with business and operational owners. Review material changes month-on-month, unexpected tower movements, unmapped cost, and allocations that conflict with known team responsibilities. Validation should include Finance for reconciliation, HR for workforce attributes, delivery leaders for team and service ownership, and TBM owners for taxonomy alignment.
Operationalize the monthly process. Automate extracts where possible, schedule the allocation run, record approvals, and maintain a change log for mapping updates. Any manual override should include the reason, approver, date, affected cost, and expiry or review date. This creates an audit trail and prevents temporary workarounds from becoming permanent model logic.
Choosing the Right Methodology
Selecting a labor allocation methodology involves trade-offs between accuracy, effort, and data availability. In practice, most organizations use a hybrid model, combining high-confidence direct mappings with more advanced methods for shared teams. The objective is to establish a defensible baseline with a clear roadmap to improve confidence over time.
- Begin with verifiable allocations. Apply direct cost center mapping to dedicated teams first, then apply additional methods as required.
- Align the method to the decisions required. If run versus change is required, prioritize timesheets or agile squad allocation for the highest-cost teams.
- Apply proxies with clear governance. Where proxy drivers are required, document the rationale, owner, and review cadence.
- Prioritize stable drivers. Choose drivers that are available monthly and do not fluctuate due to data noise.
- Make confidence levels explicit. Tag allocations by confidence band (e.g., Very High, High, Medium) so stakeholders understand where estimates exist.
In practice, most TBM models use a combination of methodologies applied to different workforce segments based on available data. A pragmatic selection framework follows three questions:
- Question 1: Is the team exclusively dedicated to one Tower or Application?
Yes >> apply Direct Cost center Mapping only after validating cost center purpose, role mix, service responsibilities, and owner confirmation. If the team supports more than one tower, apply documented splits or another allocation method.
No >> proceed to Question 2.
- Question 2: Is active time tracking or a project management system in use?
Yes >> apply Timesheet-Based Allocation using system-extracted hours.
Partial >> apply Timesheet-Based Allocation to covered staff; use Role and Rate card Mapping for the remainder.
No >> proceed to Question 3.
- Question 3: Is the team organised into agile squads with documented team-product assignments?
Yes >> apply Agile / Squad-Based Allocation using PI planning records.
No >> apply Role / Job Family Mapping to identifiable role cohorts.
For shared management and governance functions with genuinely cross-cutting effort apply Proportional/Proxy or Activity-Based Costing.
Best Practices for Labor Modelling
Start with high-confidence data, then iterate
Begin with workforce segments for which direct or role-based mapping produces a defensible result. Do not delay model release waiting for perfect data across all cohorts. A model covering 70% of labor spend with high confidence and 30% with reasonable estimates is far more useful than no model at all. Communicate confidence levels transparently and publish a roadmap for improving coverage.
Maintain a role-to-tower mapping table in addition to other relevant mappings
A role-to-tower mapping table is the foundational artefact of labor allocation whether or not a formal TBM tool is in use. This table maps each job title or job family to one or more TBM towers with associated percentage splits. Review it at every organizational restructure and at minimum annually. Version-control the table so that period-on-period comparisons remain valid.
Separate sub-pools before allocating
Always classify trackable labor into the five approved TBM staffing sub-pools before applying any Technology Resource Tower or Technology Solution allocation. Mixing internal employee labor, contractor labor, and capitalisable labor in a single pool obscures unit cost analysis, distorts benchmarking, and weakens sourcing and capitalisation insights.
Involve Finance, HR, and Delivery leaders
Labor allocation decisions directly affect how costs appear in business unit budgets. Engaging Finance early ensures GL account mappings are accurate. Engaging HR ensures headcount and role attributes are reliable. Engaging delivery leaders ensure team-product assignments are realistic and maintained. A model built in isolation is rarely trusted by those it is designed to serve.
Document every assumption
Every allocation rule, proxy driver, and percentage split should be documented with a clear rationale and an owner. At minimum, document: the method applied, the data source used, the date last reviewed, and the name of the person accountable for the assumption. This is the audit trail that allows a CIO to stand behind the numbers when challenged.
Target the highest-value cohorts first
In most organizations, the top five to ten cost centers by labor spend account for the majority of total IT labor cost. Prioritising methodology improvement for these cohorts — moving them from proxy allocation to timesheet-based, for example — delivers the most material improvement in model accuracy. Apply an 80/20 rule: cover 80% of labor spend with high-confidence methods before refining the remaining 20%.
Conclusion and Key Takeaways
Labor allocation is often the determining factor in whether a TBM model is trusted. A practical approach is to begin with high-confidence allocations, apply additional methodologies as needed, and make assumptions transparent through governance and auditability. The objective is a repeatable model that supports better decisions, rather than a fully optimised allocation from inception.
- Separate trackable labor into the five staffing sub-pools before allocating to Technology Resource Towers or Technology Solutions. This protects benchmarking, sourcing, and capitalisation insights.
- Start with what you can prove. Map dedicated teams directly first, then apply more advanced methods only where teams are shared.
- Match the method to the decision. Use timesheets or agile squad allocation where accuracy matters most, for example high-cost teams, product cost, and run versus change.
- If you must use proxies, choose stable drivers, document the rationale, and set a review cadence so assumptions stay defensible.
- Make confidence visible. Tag allocations by confidence band and maintain an audit trail of mapping tables and rule changes.


